Spitzer Ejecta Spectral Model

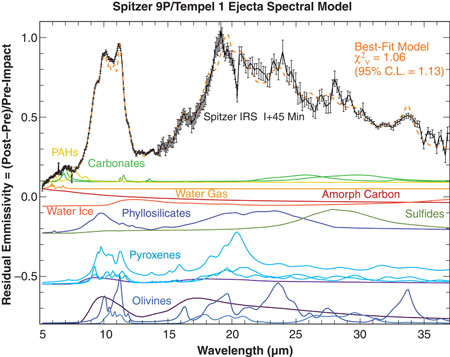
To extract information about the dust composition of Tempel 1's debris, scientists subtracted the post-impact spectrum from the pre-impact spectrum and divided it by the pre-impact spectrum. The result is shown in black. Then a modeled spectrum was generated from optical constants of individual mineral and ice components, represented by the colored spectra. The modeled spectrum, derived by mathematically combining different proportions and particle sizes of then individual constituents is shown by the dotted orange line. The best fit is the modeled spectrum that is the closest match to the observed spectrum. The mineral components are listed.
Emissivity spectrum for the Tempel 1 ejecta, measured at impact I + 45 min. Silicates dominate the observed emission. The black line shows the SST ejecta spectrum, divided by the pre-impact spectrum normalized to a 235 K blackbody. Error bars are ±2. The orange dashed line shows the best-fit model spectrum. The colored curves show emission spectra for the constituent species, scaled by the ratio B[Tdust(a)i]/B(Tpost-impact), where the temperature T is for a particle of radius a and composition i, and Tpost-impact = 390 K is found from the best fit of a blackbody B to the post-impact continuum. The best-fit model individual species curves have been scaled by a factor of 2 versus the data for emphasis. Dark purples, amorphous silicates of pyroxene or olivine composition. Light blues, crystalline pyroxenes: ferrosilite, diopside, and orthoenstatite, in order of 20-µm amplitude. Dark blues, crystalline olivines, forsterite, and fayalite, in order of 20-µm amplitude. Red, amorphous carbon. Deep orange, water ice. Light orange, water gas. Yellow, PAHs. Bright greens, carbonates: siderite and magnesite, by order of 7-µm emissivity amplitude. Olive green, sulfides, represented here by niningerite.
CREDIT: NASA/UM C. M. Lisse et al., Science 313, 635 (2006); published online 13 July 2006 (10.1126/science.1124694). Reprinted with permission from AAAS. Permission to reproduce.


