


Maps and Spectra of Ice-rich Areas
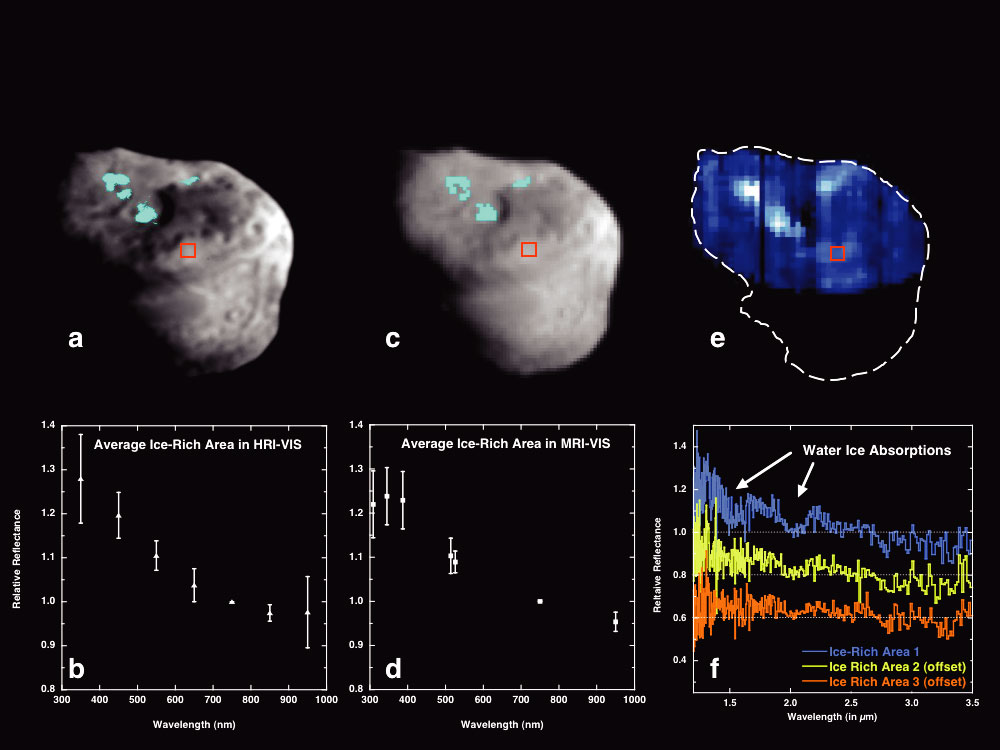
Maps and spectra of ice-rich areas relative to non-ice regions of the nucleus. a) and b) HRI visible (16 m/pixel); c and d) MRI visible (82 m/pixel); e and f) IR (120 m/pixel) data. Note the IR scan at the highest resolution (e and f) only covers the upper half of the nucleus, as shown. The ice-rich areas are mapped in the visible images as combinations of high 450/750 nm (or 387/750 nm for MRI) and low 950/750 nm, and in the infrared by the strength of absorptions at 2.0 µm. The visible spectra are scaled to a value of 1.0 at 750 nm, while the IR spectra are scaled at the same value at 2.0 µm. To facilitate detection of these subtle variations, all data are scaled to the same broad smooth area of the nucleus, indicated by the red boxes. IR spectra from each of the three ice rich regions include distinct absorptions due to water ice (f).
CREDIT: NASA/UM/SAIC J. M. Sunshine et al., Science 311, 1453 (2006); published online 2 February 2006 (10.1126/science.1123632). Reprinted with permission from AAAS. Permission to reproduce.