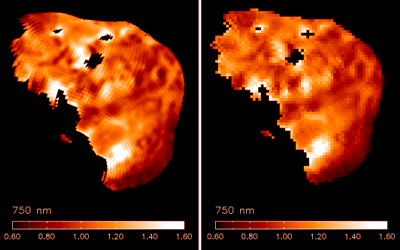
Tempel 1 Albedo Maps

Hi-Res GIF (147 KB)
Maps of the albedo of the nucleus of Tempel 1 from before impact. Left image is from the HRI and right is from MRI instruments. Data with emission angle greater than 70° is not displayed and appears black. The map, displayed in red tones, because the light passed through a red filter with central wavelength of 750 nm, shows variations from the mean albedo designated as 1.00 in the map. The variations in albedo correlate with small scale topography that is not accounted for in the shape model. Thus the variation is due only to the angle at which light hit the nucleus and reflects surface morphology. Note that the human eye cannot detect light at 750nm, so the color is purely for display purposes.
CREDIT: NASA/UM/Jianyang Li


