Vapor Plume Spectrum

Hi-Res JPEG (504 KB)
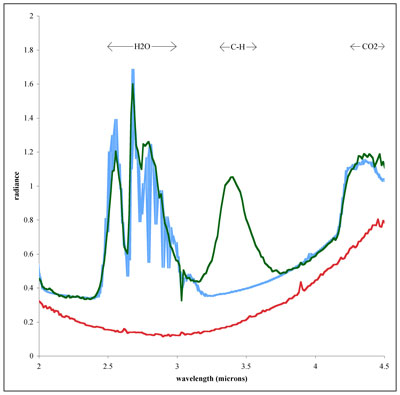
Spectrum of vapor blume (green) at ~I+0.6s. The red line is the nuclear spectrum taken 0.7s earlier. The blue line is a model spectrum that includes the observed nuclear spectrum, hot (850 K) dust, and three identified species. However, organics are not included resulting in the difference in the model and observed spectra at 3.4µm.
CREDIT: NASA/UM M. F. A'Hearn et al., Science 310, 258 (2005); published online 8 September 2005 (10.1126/science.1118923). Reprinted with permission from AAAS. Permission to reproduce.


