


Sequence Symphony - A Piece in Nine Movements by Ken Klaasen and the Deep Impact Science Team
By Lucy McFadden, Co-Investigator and E/PO Manager
The Deep Impact experiment is a veritable symphony composed by the science team to produce the sequence of data that will get us information about the structure and chemical composition of the interior of our target comet, Tempel 1.
The conductor is the PI, Mike A'Hearn (Fig. 1). His score has measures for three different instruments: the MRI, HRI and the IR spectrometer component of the HRI.
 |
Fig. 1 Mike A'Hearn, Deep Impact Principal Investigator |
Sitting in the first violinist's chair is Deputy PI, Mike Belton (Fig. 2) with a career's worth of experience planning and executing space science missions.
 |
Fig. 2 Deputy PI Mike Belton |
Our music, this month has been composed by science team member Ken Klaasen of the Jet Propulsion Lab with his able assistant Alejandro Soto (Fig. 3). Working as a team, this group of scientists defined the mission's measurement objectives. Ken transposed the objectives into a series of instrument pointings, settings and exposure times which when combined form the experiment's data sequence.
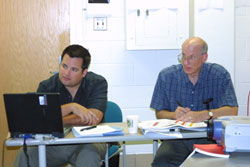 |
Fig. 3 Alejandro Soto (left) and Ken Klaasen (right) developed the sequence. |
Today, we are rehearsing the score. We are going through every movement and asking ourselves, how does this sound? Will this give us the data that we need to answer our science objectives that will tell us about the interior of the comet? (To recall the science objectives, see Ray Brown's articles.)
In today's rehearsal, our symphony is at 26 hours before impact.
We do something that doesn't always happen in the music world, the conductor requires the composer to present his work and asks the orchestra or the science team, to review the music. This was done on a hot, humid day in College Park, MD on June 17th. Let's stop in on a bit of the rehearsal.
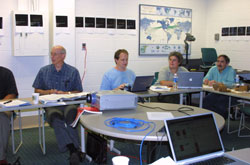 |
Fig. 4 Members of the science team working on the sequence review. From left to right, Ken Klaasen (JPL), Tony Farnham (UMd), Jessica Sunshine (SAIC), Pete Schultz (Brown University). |
Maestro Klaasen has produced several movements with names referring to times before, during and after impact. We begin with the Approach phase, move into Late Approach, then on to Prehit, Hit, Post Hit, High Res and Look Back 1 and Look Back 2. We read our score on multiple excel spread sheets. There are lists of commands with associated information about where the instruments will point, the exposure time, what filters will be used and whether the data will be sent directly to Earth or stored on the flyby spacecraft and then sent to Earth. Ann Harch, at Cornell University, has created some plots that display visual schematics of the comet at any point in time (fig. 5). The frame or footprint of each instrument is applied to a wire-frame representation of the comet.
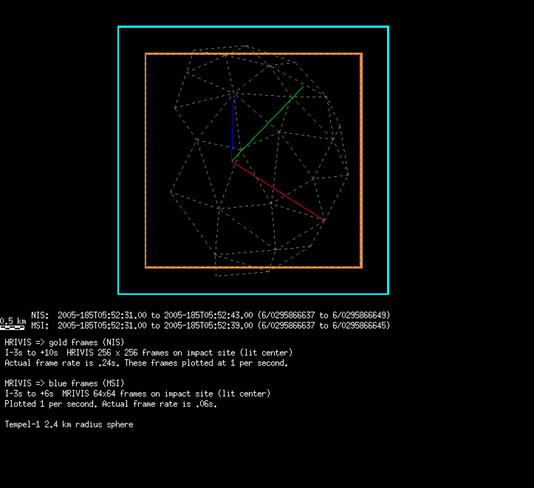 |
Fig. 5 A wire-frame representation of a spherical comet with the footprint of the HRI imager in gold and the MRI imager in blue. We will get this image at Impact -3seconds.
(Click to enlarge) |
We also have line plots showing the edge of each instrument and the angular size of the comet represented along the vertical axis (Fig. 6). Along the horizontal axis we plot time. These graphs allow us to look at each movement in one image. They look somewhat like a musical score. As we approach the comet, our observations are relatively simple.
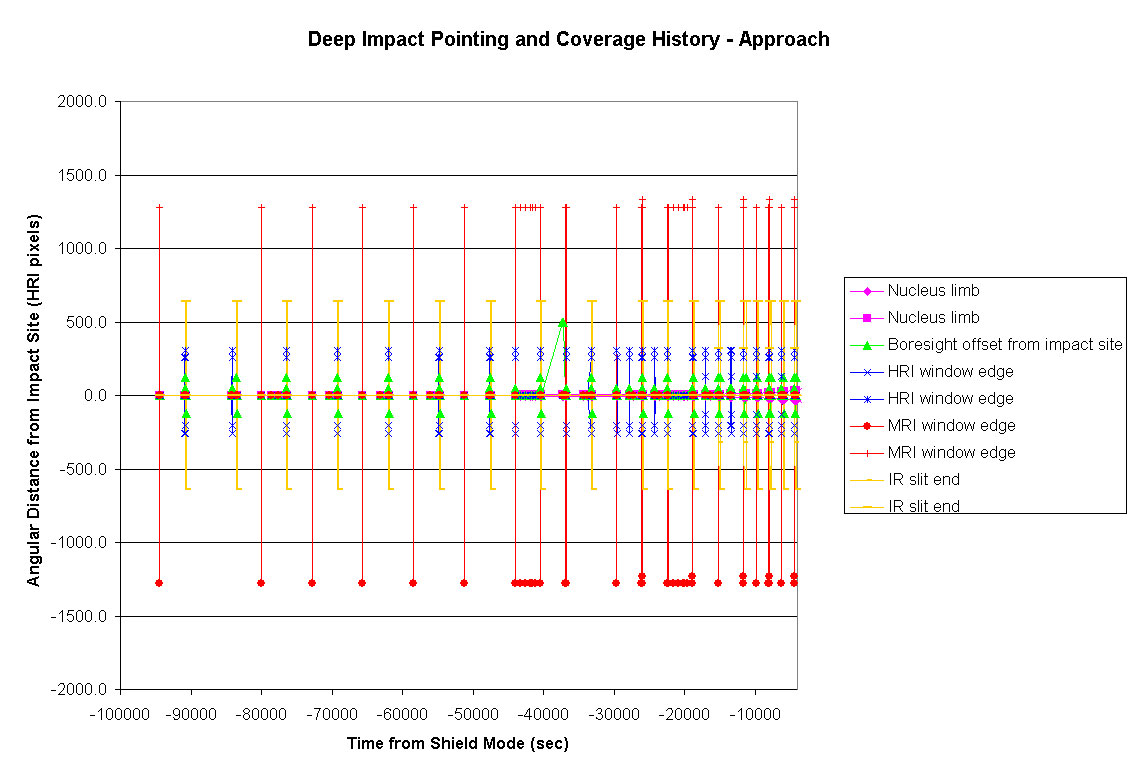 |
Fig. 6 The numbers on the x-axis represent seconds before the spacecraft enters shield mode, a period of time when the spacecraft protects itself from dust particles as it travels through the orbital plane of the comet where dust particles are expected to be most concentrated . In this figure, the vertical axis represents the number of pixels (picture elements) above and below the impact site. The green triangles are the location that the telescope is pointing relative to the impact site. The dark pink squares represent the edge of the comet. The edge of the HRI is shown in blue, while the MRI is red and the Infrared slit is yellow.
(Click to enlarge) |
When we are far from the comet, the separation between pink squares is small. Notice it will get bigger in future movements. The sequence of events that the scientists lay out will be converted to computer commands that will execute the experiment to study the interior of Tempel 1. With training and rehearsal, the science team can read these plots like a musical score.
 |
Fig. 7 The phase of the mission data collection called Late Approach
(Click to enlarge) |
In the time before impact, we had to stop taking some data, due to engineering constraints, there are no red, blue or yellow notes for a period of time, can you see this in the plot? We ended up filling our computer memory and in order not to fill it before critical observations at impact and immediately after, we decided to pause in our data collection. See Fig. 8 between the time -1380 and -1150 sec for an example of this pause.
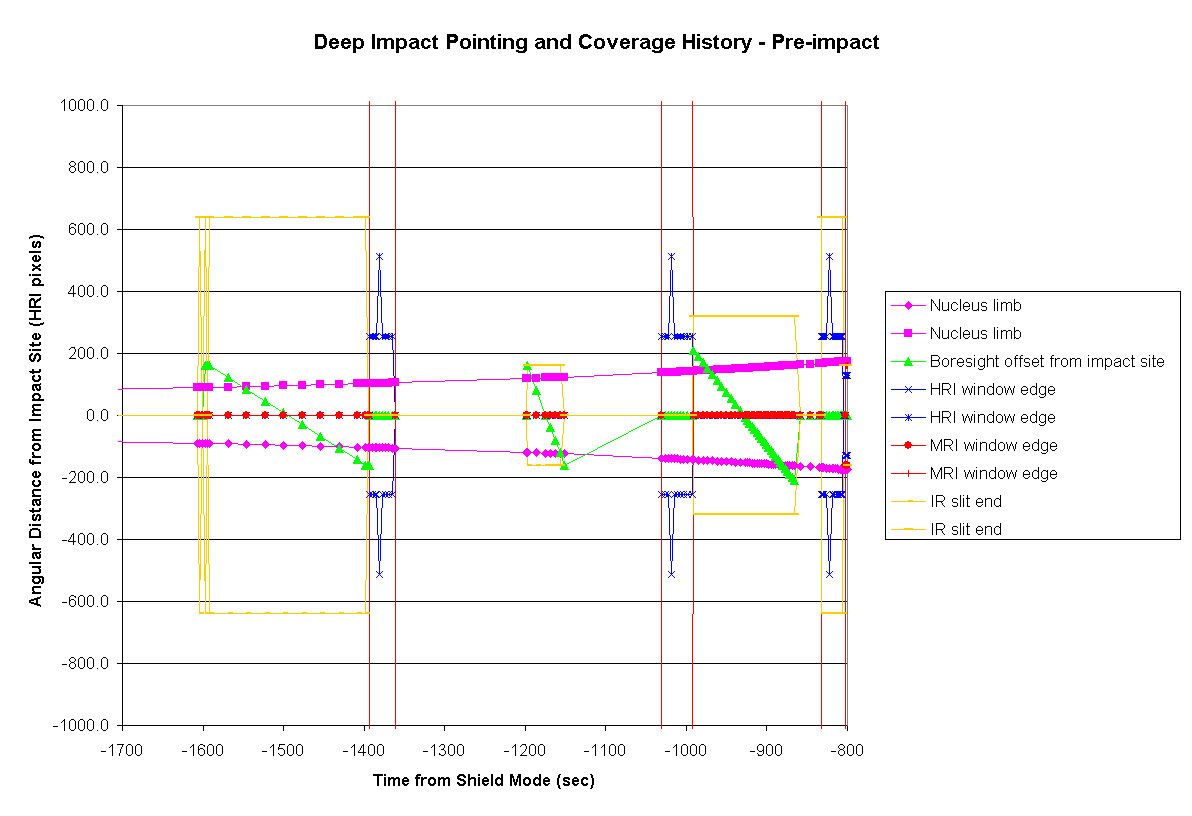 |
Fig. 8 The phase of the data collection sequence called Prehit.
(Click to enlarge) |
We go over every movement, note by note.
We discuss whether the score will get us what we need.
Our science team has members with different expertise and responsibilities, like musicians playing different instruments (Fig.9).
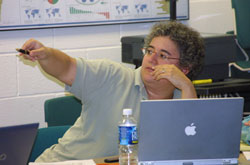 |
Fig. 9 Jessica Sunshine making a point. |
Intermission is at 12:30 when we break for lunch. We are just before Impact! We walk over to the Campus center and eat at Adele's, thinking about how they might rename items on their menu to celebrate the Deep Impact mission.
After lunch we get right back to work. Here is the music at impact.
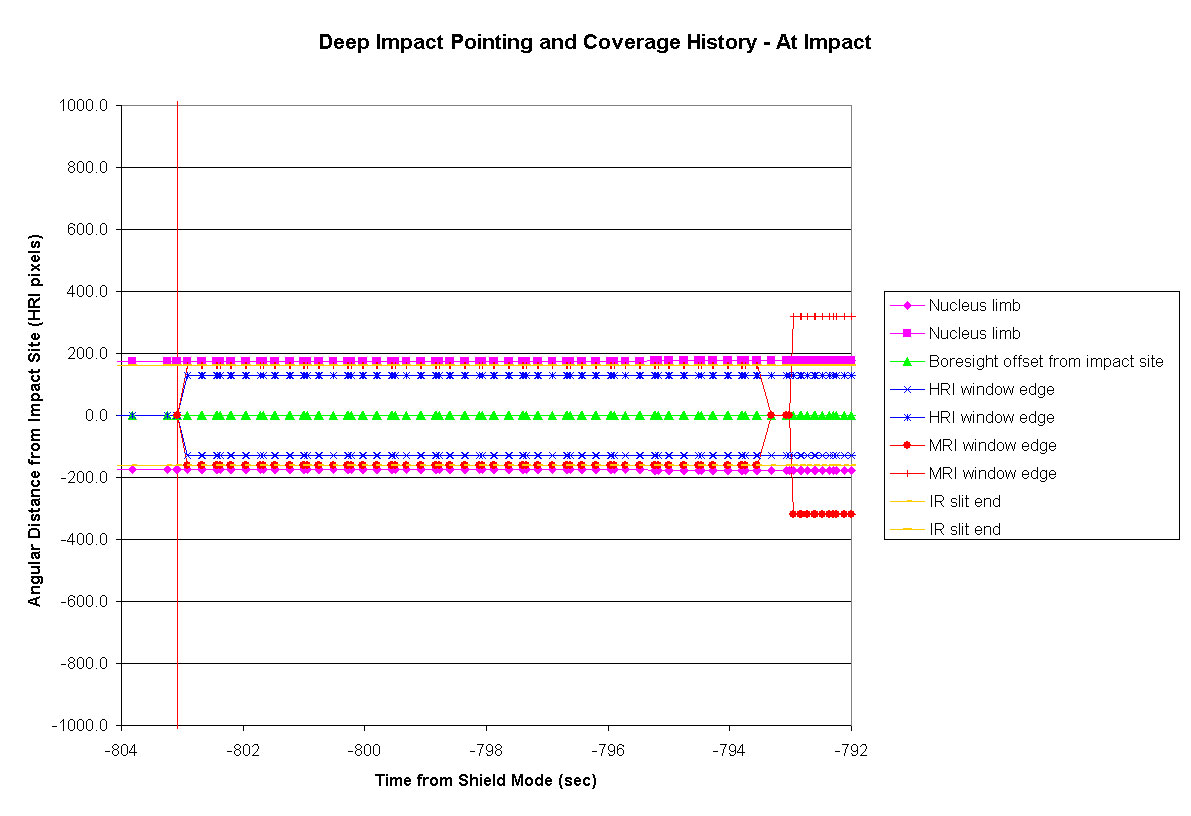 |
Fig. 10 The data collection sequence at the time of impact.
(Click to enlarge) |
We continue through the score.
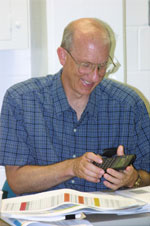
Melosh (Fig. 11) and Schultz listen carefully after the impactor has hit the comet. They want to see the impact crater and the ejecta curtain traveling away from it. We have to be sure to observe the entire comet so we can find the impact crater. What if the interior of the comet absorbs the impactor and throws off no ejecta? We want to be sure to have the entire comet to look at to compare with images taken before impact.
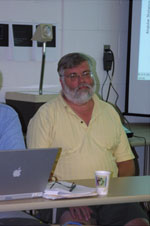 |
Fig. 11 Jay Melosh (U. Arizona) listens to discussion about the impact and post impact sequence. |
Others think out loud and say, "but it may produce a big and bright ejecta curtain, we don't want to over expose the camera." So we define a series of observations with different exposure times, to bracket the possibilities.
After impact, things get more complicated. We want to watch the evolution of the ejecta cone and to look inside the crater after the ejecta has fallen back to the surface of the comet. Here's how that looks in our symphonic sequence (Fig. 12)
Here our half notes and quarter notes are created by reading 1/2 and 1/4 of our detector, so that we can get more images in a given period of time. The pace is picking up. We get smaller images but it allows us to look more frequently.
 |
Fig. 12 The sequence of data collection after impact when we take data at a faster rate.
(Click to enlarge) |
We applaud the composer at one point, because we have a long discussion about changing some measures. We argue different positions, and in the end, we realize that the way it is written is the best approach to getting the data we need.
 |
Ken Klaasen is pleased with this outcome (Fig.13). |
There are no more intermissions, because we want to complete the rehearsal all in one day. But when our administrative assistant, Linda Diamond brings in cookies in mid-afternoon, they get passed around and gobbled up. Here is the final movement, when we go into shield mode (Fig. 14).
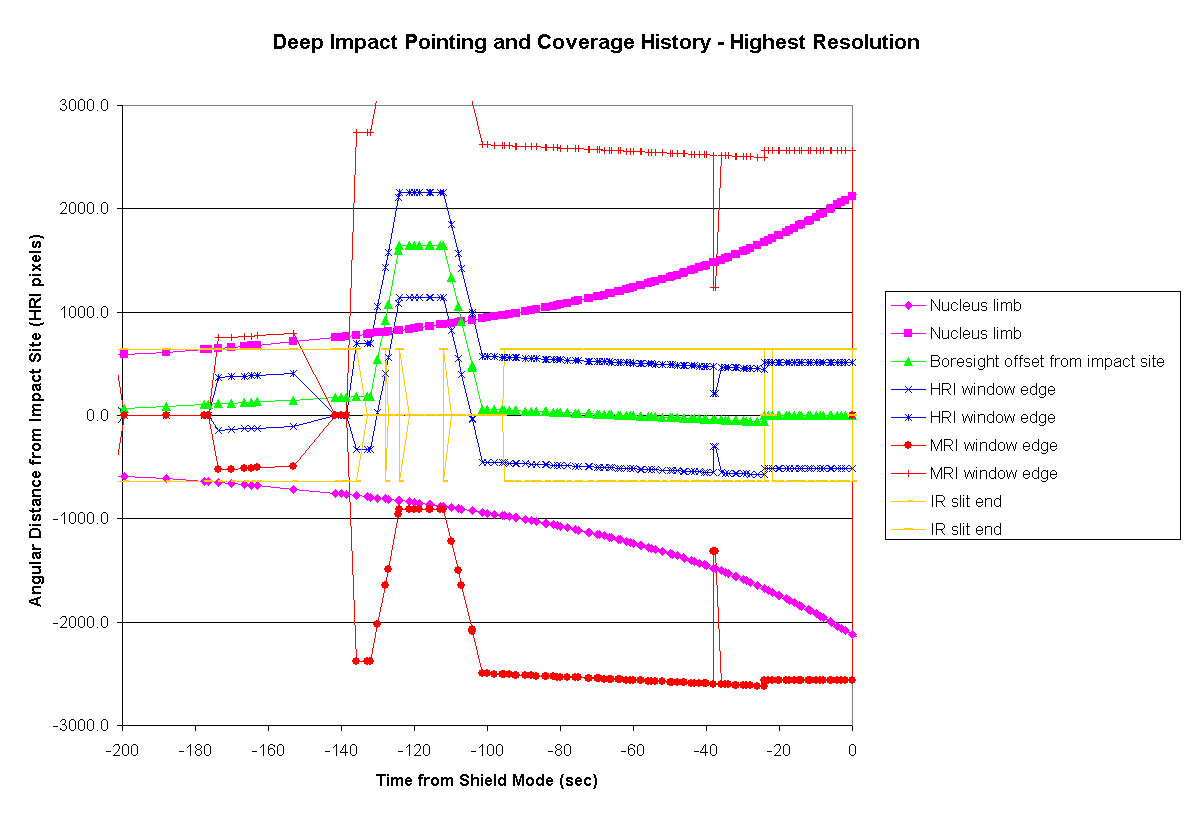 |
Fig. 14 The sequence of data collected at highest resolution after impact.
(Click to enlarge) |
Finally there is the peaceful Look Back phase (Fig. 15).
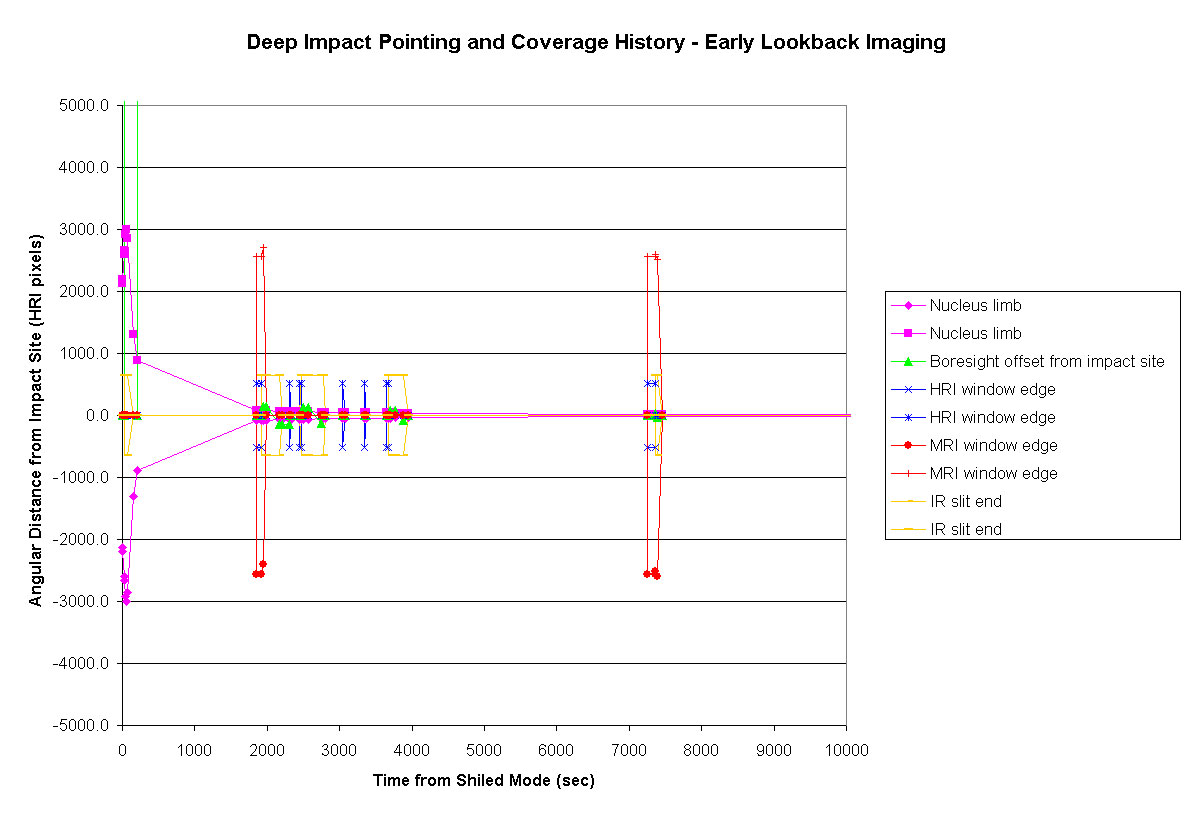 |
Fig. 15 Looking Back at the comet after impact.
(Click to enlarge) |
Jay Melosh has to catch an airplane, so we say good bye to him (Fig. 16).
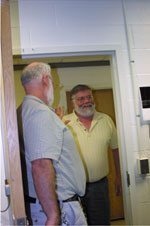 |
Fig. 16 Jay Melosh leaves to catch a plane. |
It is 4:45pm. Some team members have to leave to catch a plane home. We have done three of our four instruments. We now have to go through the ITS sequence, on the impactor. Jess Sunshine, who is thinking about getting to her real orchestra performance that night, notes that at least we only have to go up to impact in this movement.